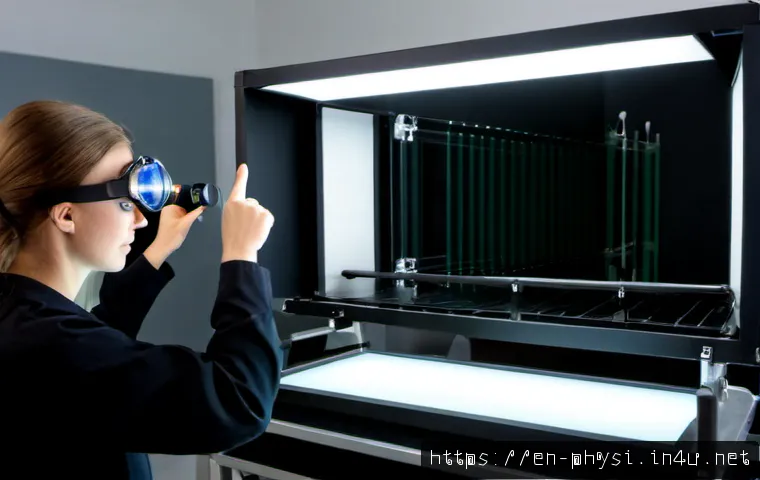
In today’s fast-paced academic environment, mastering the art of writing physics lab reports is more crucial than ever. With the rise of remote learning and virtual labs, clear and accurate documentation ensures your findings stand out and communicate effectively.

Whether you’re a student aiming for top grades or a budding scientist honing your skills, this guide will walk you through each step to craft impactful reports.
I’ve personally found that a well-structured report not only saves time but also boosts confidence during presentations. Dive in to discover practical tips and proven strategies that turn complex data into compelling narratives.
Let’s unlock the secrets to writing lab reports that truly make a difference!
Organizing Your Data for Maximum Clarity
Choosing the Right Format for Your Data
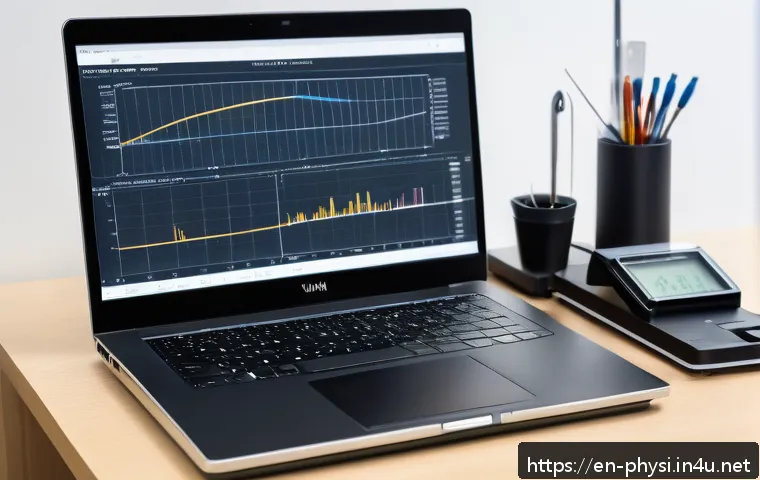
When it comes to presenting data in a physics lab report, the format you choose can either make your results shine or confuse your readers. From my experience, tables work wonders for numerical data that needs to be compared side-by-side, while graphs are perfect for showing trends and relationships.
For example, when measuring velocity changes over time, a line graph instantly communicates the pattern much better than raw numbers ever could. It’s important to pick the format that best fits the type of data you’re dealing with, so your audience can grasp the findings quickly and accurately.
Labeling and Units: Small Details Matter
One mistake I’ve often seen is overlooking proper labeling or forgetting units, which can make even the most precise data useless. Always double-check that every column, axis, and data point is clearly labeled with the variable name and its unit.
Units like meters (m), seconds (s), or newtons (N) aren’t just formalities—they provide essential context. Imagine presenting a set of numbers without specifying whether time is in seconds or minutes; it would leave readers guessing and diminish your report’s credibility.
Taking time to get these details right reflects professionalism and attention to detail.
Using Tables Effectively to Summarize Results
Tables are a staple in physics reports because they can neatly organize a lot of information in one place. But a cluttered or poorly designed table can overwhelm instead of clarify.
When creating tables, keep them simple and focused—group related variables together and avoid unnecessary decoration. I always include a descriptive title and make sure the table fits well within the flow of the report, so it feels natural rather than forced.
The following table exemplifies a clean layout to record measurements during a projectile motion experiment.
| Measurement | Trial 1 | Trial 2 | Trial 3 | Average |
|---|---|---|---|---|
| Initial Velocity (m/s) | 12.5 | 12.7 | 12.6 | 12.6 |
| Time of Flight (s) | 2.3 | 2.4 | 2.3 | 2.33 |
| Maximum Height (m) | 7.1 | 7.0 | 7.2 | 7.1 |
Crafting a Clear and Concise Methodology
Detailing Each Step Without Overloading
Writing the methodology section can feel like walking a tightrope—too vague, and your experiment can’t be replicated; too detailed, and you risk boring your reader.
I’ve found that the sweet spot is to describe the process clearly but succinctly. Focus on key actions, equipment used, and any specific settings or measurements that are crucial.
For instance, instead of listing every tiny movement, describe the overall setup and the sequence of actions that led to data collection. This approach saves time for the reader and keeps the report engaging.
Highlighting Equipment and Calibration
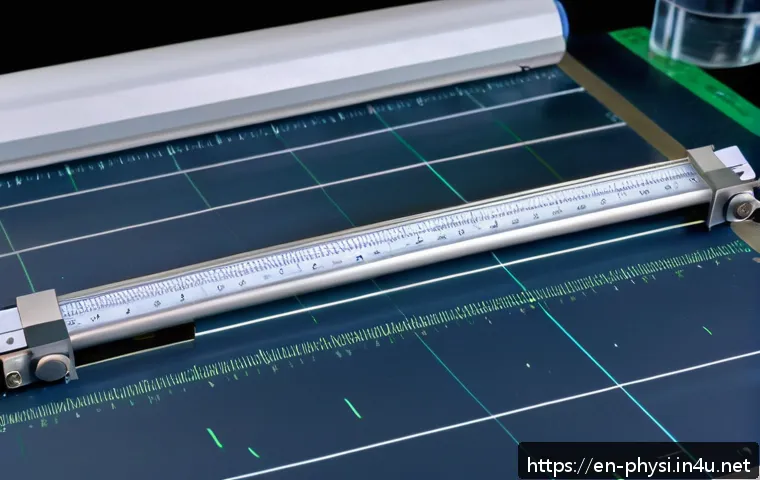
The equipment you use and how you calibrate it can hugely impact your results, so don’t skip this part. When I include equipment details, I mention model numbers and any calibration procedures because this adds credibility and allows others to assess the precision of the experiment.
For example, specifying that a Vernier caliper was zeroed before measurement shows you took care to minimize error. It’s these little touches that separate a good report from a great one.
Anticipating Questions with Clarity
Think of your methodology as a guide for someone else to repeat your work. If I ever felt stuck redoing an experiment, it was usually because the original report lacked clarity in this section.
To avoid that, I try to write the methodology from the perspective of a first-timer—would they understand exactly what to do? If not, I add extra explanation or illustrations.
This mindset not only improves your report but also your understanding of the experiment itself.
Interpreting Results with Insight and Honesty
Going Beyond Numbers: What Do They Mean?
It’s tempting to just present data and call it a day, but the real value lies in interpreting what those numbers reveal. When I analyze results, I ask myself what story they tell about the physical principles involved.
For example, if you measured acceleration due to gravity, do your results align with the expected 9.8 m/s²? If not, why might there be discrepancies? This reflection shows critical thinking and deepens your report’s impact.
Addressing Uncertainties and Errors Transparently
No experiment is perfect, and acknowledging uncertainties isn’t a weakness—it’s a strength. I make it a point to include a discussion on possible sources of error, whether it’s equipment limitations, environmental factors, or human mistakes.
Being upfront about these issues builds trust with your readers and demonstrates scientific integrity. Plus, it sets the stage for future improvements or investigations.
Using Visuals to Support Your Analysis
Graphs, charts, and diagrams don’t just decorate a report—they’re powerful tools to reinforce your conclusions. I always try to include visuals that highlight key trends or anomalies in the data.
For instance, a scatter plot with a best-fit line can clearly show the relationship between variables and help explain deviations. When visuals are well-integrated, they make the interpretation easier to follow and more persuasive.
Mastering the Art of Technical Writing Style
Balancing Formality with Readability
Physics reports demand a formal tone, but that doesn’t mean you should write like a robot. I’ve learned that using straightforward language while avoiding jargon overload makes your report accessible to a broader audience.
Think of it as explaining your findings to a curious friend who’s smart but not an expert. This balance keeps the text professional yet engaging, preventing readers from zoning out halfway through.
Active Voice vs. Passive Voice: When to Use Each
Traditionally, many lab reports favor passive voice (“The experiment was conducted…”), but I’ve found that mixing in active voice (“We measured the voltage…”) can make your writing clearer and more dynamic.
Active voice puts the focus on the doer, which can improve flow and reader engagement. The key is to use whichever voice best suits the context—passive for emphasizing the process, active for clarity and brevity.
Consistency is Key: Terminology and Formatting
Inconsistent terminology or formatting is a subtle but common pitfall that can confuse readers. I always create a glossary or list of abbreviations if my report includes specialized terms and stick to one style for units, symbols, and headings.
Consistency extends to font choice, margin settings, and numbering sections. This uniformity not only looks professional but also helps readers navigate your report effortlessly.
Integrating References and Supporting Literature
Crediting Sources Correctly
Referencing is essential in any scientific writing to give credit and strengthen your arguments. I make sure to cite all sources of theories, formulas, or previous experiments that influenced my work.
Using a consistent citation style—APA, MLA, or IEEE, depending on the guidelines—also adds polish. Proper referencing shows respect for intellectual property and adds authority to your report.
Incorporating Relevant Background Information
Including a brief background section helps readers understand the context of your experiment. I usually summarize key concepts and highlight why the experiment matters in the bigger picture.
For example, explaining how measuring resistivity contributes to electronics design connects your work to real-world applications, making it more relatable and interesting.
Using Literature to Explain Deviations
Sometimes your results won’t match expectations perfectly, and that’s okay. When this happens, I turn to existing literature to find explanations or similar observations.
Citing studies that report comparable anomalies or experimental challenges can validate your findings and show you’ve done your homework. It’s a smart way to frame unexpected results without undermining your report’s credibility.
Polishing Your Report for Final Submission
Proofreading: Catching the Hidden Errors
Even the most carefully crafted report can suffer from overlooked typos or grammatical slips. I recommend reading your report aloud or having a peer review it to catch errors your eyes might miss.
Small mistakes can distract readers and lower their confidence in your work, so investing time in proofreading pays off big.
Formatting for Professional Presentation
A clean, well-organized layout enhances readability and leaves a positive impression. Use headings and subheadings logically, insert page numbers, and ensure figures and tables are neatly placed with captions.
From personal experience, a polished format makes a huge difference when professors or reviewers skim through multiple reports—they notice the extra effort and it can boost your grade.
Final Checklist Before Submission
Before hitting submit, I go through a checklist: Are all sections complete? Is data presented clearly? Have I cited everything?
Are units consistent? Did I explain uncertainties? This last step might feel tedious, but it’s your chance to catch anything that could weaken your report.
Trust me, a thorough final review is the difference between good and outstanding work.
In Conclusion
Organizing and presenting your physics lab report with clarity is essential for effective communication. By carefully choosing formats, detailing methods, and interpreting results honestly, you ensure your findings are both understandable and credible. Remember, attention to detail and thoughtful presentation can elevate your work from good to exceptional.
Helpful Tips to Keep in Mind
1. Always match your data presentation style to the type of information—use tables for comparisons and graphs for trends.
2. Double-check that every label and unit is included to avoid confusion and maintain professionalism.
3. Write your methodology clearly but concisely, focusing on key steps and equipment calibration.
4. Interpret results thoughtfully, addressing errors transparently to build trust with your readers.
5. Proofread thoroughly and format your report neatly to make a strong final impression.
Key Takeaways
Successful physics reports balance precision with readability. Consistency in terminology and formatting helps maintain professionalism, while integrating relevant references strengthens your arguments. Don’t shy away from discussing uncertainties—they demonstrate scientific integrity. Ultimately, clear communication combined with careful analysis makes your report stand out and supports the advancement of knowledge.
Frequently Asked Questions (FAQ) 📖
Q: uestions about Writing Physics Lab ReportsQ1: What is the most important section to focus on in a physics lab report?
A: While every section plays a crucial role, I’ve found that the Discussion section often carries the most weight. This is where you interpret your data, explain anomalies, and connect your findings to the theoretical background.
A clear, insightful discussion not only shows your understanding but also impresses instructors or peers reviewing your work. Make sure to back up your claims with data and avoid vague statements.
Q: How can I make my physics lab report stand out in a virtual learning environment?
A: Virtual labs can sometimes make data feel less tangible, so clarity becomes key. Using well-labeled graphs, tables, and detailed step-by-step explanations helps your report shine.
I’ve personally seen that incorporating screenshots or brief video clips (if allowed) alongside your written analysis adds a dynamic touch. Also, double-checking your units and calculations ensures accuracy, which is always appreciated in digital submissions.
Q: How detailed should the methodology section be for a physics lab report?
A: The methodology should be thorough enough that someone else could replicate your experiment exactly. From my experience, including specific equipment models, settings, and any calibration steps makes your work more credible and professional.
Don’t skip over seemingly small details—those often make a big difference in reproducibility and show your careful approach to the experiment.